- 340B Impact Overview
- Performance Overview Page
- Drug Spend Page
- Hospital Savings Page
- Net WAC Impact Page
- Retail Performance Page
- Generics Optimization Page
- Mixed Use Optimization Page
- Orphan Optimization Page
- 340B Impact Education Videos
- Account Table Page
-
Updates & Announcements
-
340B Architect
-
340B Impact
-
340B RxCorrelate
-
340B Monitor
-
340B Written Location
-
340B Central Split
-
All About Architect Webinar Series
-
More Resources
-
Right Side Callout
-
Recent Manufacturer Notices
-
More Videos
Overview
340B Impact allows you to view data aggregated across your health system, including all HIDs, PIDs, and data from McKesson accounts not visible in 340B Architect. Your data is displayed as interactive visuals using Microsoft Power BI, with filters and drilling features that allow you to view data across your health system. These features provide insight into your 340B Program performance and help identify potential opportunities.
Navigating to 340B Impact
When you log in using mhiapps.com, you will be directed to the last product you were logged into. To access 340B Impact, select it from the product drop-down menu. If the 340B Impact selection is not available, or it is grayed out, contact your 340B Program manager or Macro Helix Support for assistance.
If you are unable to view the data in 340B Impact and the page appears blank, you may need to check with your IT team to whitelist the following VPNs:
- http://content.powerapps.com/
- http://wabi-south-central-us-redirect.analysis.windows.net/
- http://app.powerbi.com/
See the sections below to learn how to navigate between pages and use the visual menu options and other functionalities.
340B Impact Menu
Use the collapsible left menu pane to navigate within 340B Impact. The Performance Overview page is a consolidated dashboard of all the other pages. Drug Spend, Hospital Savings, Net WAC Impact, and Retail Performance are aggregated analytic pages, focusing on data indicated by the page titles. The Generics, Mixed Use, and Orphan Optimization pages list potential opportunities and track realized savings by PID.
Some menu options will not display if they are not relevant to your Health System. See those options below:
Net WAC Impact will not display for health systems that do not have at least one covered entity with a WAC account.
Retail Performance will not display for health systems that do not have at least one retail pharmacy (hospital-owned/specialty or contract pharmacy).
Orphan Optimization will not display for health systems that do not have at least one covered entity subject to the Orphan Drug Exclusion.
Date Range Options and Current Filters
This top section provides quick access to date range display options and Current Filters to view your data. By default the options are set to display data Monthly and for the past 12 Months from the current date. Date range options allow you to choose how the data is displayed (Monthly or Quarterly) and for how many consecutive months (12 Months, 3 Months, or a Custom). Quarters are based on the standard calendar year (Q1/Jan – March). Data is displayed for completed months from the current date.
You can filter the data being displayed by Hospital, Service Type, and Location for your health system. These filters are available at the top of the pages for quick access, as they are the three most commonly used filters. Be aware they are also listed as the same in the right-panel Filters.
- Hospital: Covered entity(s) that are part of your health system that are participating in the 340B Program.
- Service Type: Identifies different standard areas of your health system’s 340B program, including hospital mixed-use, hospital ambulatory, hospital-owned retail, contract pharmacy-retail, contract pharmacy specialty, etc.
- Location: Contract pharmacy chains are grouped together. Health systems may also choose to group their hospital outpatient pharmacies together.
Date range options and the Location filter are not available on the Optimization pages.
Current Filters displays all the filter selections currently being applied to the page. Use Clear Filters to clear all selections and revert to the default view of the prior 12 completed months from the current date.
Right Filters Pane
This collapsible panel includes additional filter options to refine the data on the page. You can search criteria and values within each filter and select/de-select one or more filters. You can apply as many filters as needed and they will remain until cleared.
All filters are available for the Performance Overview, Drug Spend, Hospital Savings, Net WAC Impact, and Retail Performance analytics pages. A smaller set of filters are available for the Generics, Mixed Use, and Orphan optimization pages. Filter selections applied will persist as you navigate between pages.
To learn more, see the article 340B Impact Filters Defined.
Visual Functionality Options
Additional functionality options are available within the visuals across 340B Impact. As you interact with the visuals, apply filters, and use other options, all visuals and amounts throughout the page automatically update.
Data Interactions
Hover over specific data points to obtain additional detail.
Click on a specific data point to apply that data point as a filter. Clicking on another data point will reset the filter.
CTRL + Click: If you want to select multiple data points to review, hold the control button while clicking on each data point.
General Menu Options
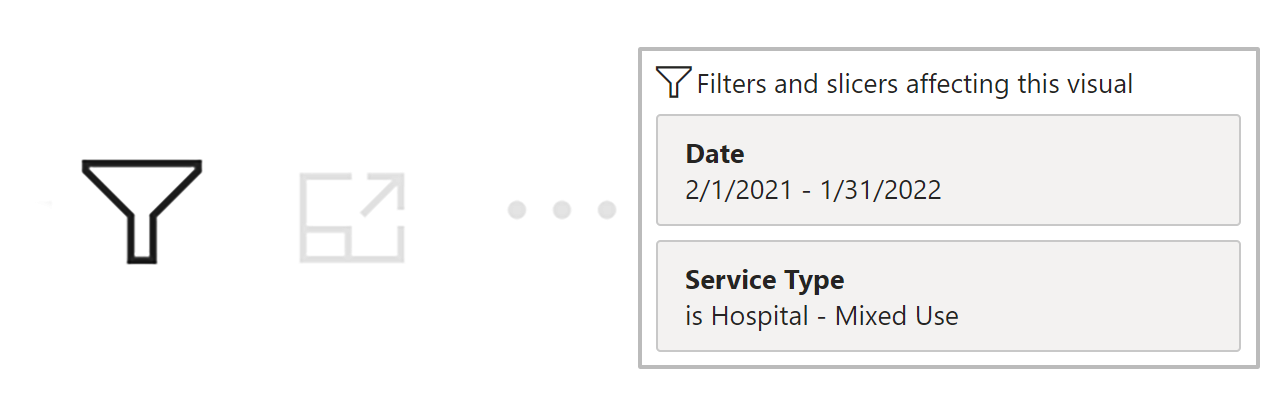
Hover over a graph or table visual to reveal the icon menu. Hover over the Filter icon and a list of applied filters affecting that visual appears. These are the same filters applied under Current Filters, which becomes helpful the further you scroll down the page, preventing you from scrolling up and down to see Current Filters.
When you click the Focus mode icon that visual expands to fill the page. Click Back to report to revert the visual to the original size.

When you click on the More options icon, additional options for that visual are revealed. These additional options will very by each graph or table.

Drill Features
Some graphs/tables have drill features to explore your health system's data, such as the Across System, Drug/Category, and Drug Detail visuals. A hierarchy of data is required for the drill features to be available.
Health System Hierarchy
This data hierarchy is found on the Across System visuals within the analytic pages Drug Spend, Hospital Savings, Net WAC Impact, and Retail Performance. Below is the order of this hierarchy starting with Hospital.
- Hospital: Covered entities that are part of your health system that are participating in the 340B Program.
- Service Type: Identifies different standard areas of your health system’s 340B program, including hospital mixed-use, hospital ambulatory, hospital-owned retail, contract pharmacy retail, contract pharmacy specialty, etc.
- Location: Contract pharmacy chains are grouped together. Customers may also choose to group their hospital outpatient pharmacies together using their account table setup.
-
Account: The individual purchasing account used to purchase drugs for your 340B Program.
Account is the lowest level in the hierarchy on the Drug Spend, Hospital Savings, and Net WAC Impact pages. -
PID: A unique identifier assigned by Macro Helix to identify pharmacies.
PID is the lowest level in the hierarchy on the Retail Performance page.
Drug Category Hierarchy
This data hierarchy is found on any Drug/Category or Drug Detail tables within the analytic pages Drug Spend, Hospital Savings, Net WAC Impact, and Retail Performance. Below is the order of this hierarchy starting with Therapeutic Group.
- Therapeutic Group: General drug groups frequently used in general market research and third-party prescription processing, for example, Penicillins, Contraceptives, and Anti-Diabetics.
- Therapeutic Class: Specific therapeutic drug classes designed to accommodate more detailed market research, for example, Carbonic Anhydrase Inhibitors, Loop Diuretics, and Mercurial Diuretics.
- Drug Name: The generic or chemical name of a drug, for example, Dexamethasone Acetate, and Dexamethasone Sodium Phosphate.
- Brand Group: The brand name of a drug when applicable.
- NDC: 11-digit unique drug identifier; the level at which accumulations are maintained in 340B Architect.
When you hover over a visual with drill features, you will see a combination of drill icons in the top right corner. As you explore using the drill icons, icons that appear light grey are not available for use at the level. When the icons are a darker grey color they are available for use.
These drilling features can be used independently or combined, allowing flexibility when exploring your health system's data. Below, is a description of the function for each drill icon, along with the alternative right-click option.
Drill Down
To drill down, hover over the visual to view and use the drill icons. Click the single down arrow to turn on Drill down, and then select a data point. Alternatively, you can right-click on a data point then click Drill down. As data points are selected they will be applied as Current Filters.
Go to Next Level of Data
When you click the double down arrow it will Go to the next level of data in the hierarchy. For example starting from the Hospital level of data, the next level of data to view is Service Type. The right-click option is Show next level.
Expand
Clicking Expand, the forked down arrow, expands all rows to the next level. For example, from the Spend By Drug/Category table, you can expand each row of data from the Therapeutic Group level to also view the Therapeutic Class level. Alternatively, you can use the right-click option, select Expand, and then Entire level. To expand all levels in the hierarchy at once, use the right-click option, select Expand, and then All.
Drill Up
The drill up feature functions like a back button, which can be used anytime you are below the highest level in the data hierarchy. Click the up arrow to return to the previous level in the hierarchy. Alternatively, you can hover over the visual and click Drill up.
 340B Impact General Information